1. Overview of Clearwater Beach Weather
2. Monthly Temperature Averages
3. Preparing for Your Trip
The Average Monthly Temperature and Rainfall of This Florida City
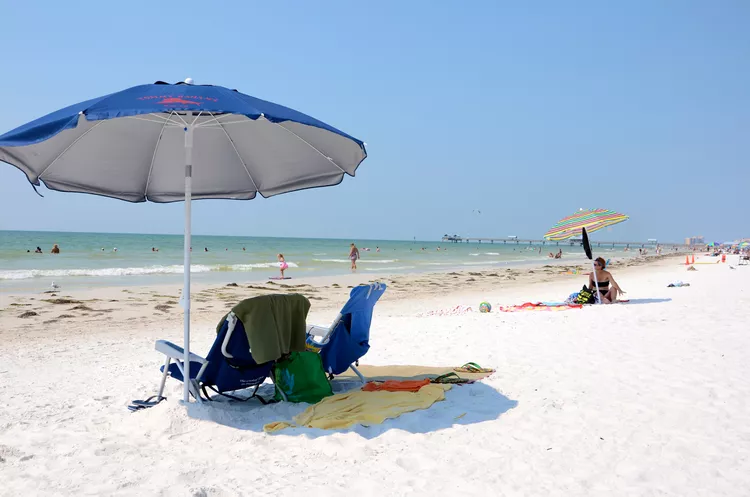
Clearwater Beach, located on Central Florida’s West Coast and home to the nightly Pier 60 Sunset Celebration, boasts an overall average high temperature of 83° and an average low of 63°.
If you’re preparing for your vacation to Clearwater Beach, it is advisable to embrace a cool and casual dress code on this barrier island. Bathing suits, shorts, and flip flops are the standard attire. Although the water temperatures can dip to a chilly 68° F during winter months, it is still worth bringing your bathing suit. With year-round sunshine, sunbathing remains a viable option, even if swimming might not be feasible.
Consequently, you will find these tips on how to beat the Florida heat especially useful during the summer months, which are known to be the warmest at Clearwater Beach. January is typically the coolest month, though sunny days can still average temperatures in the low 70s. August sees the maximum average rainfall, and it’s important to note that afternoon thunderstorms can pose serious lightning risks, particularly if you’re enjoying time on the beach.
Fortunately, Clearwater Beach has remained untouched by major hurricanes in the last decade. However, it is important to keep an eye on the tropics when traveling during the Atlantic Hurricane Season, which runs from June 1 through November 30. Additionally, learn how to keep your family safe and protect your vacation investment through effective preparation during hurricane season. Below, you will find the monthly average temperatures, rainfall, and Gulf of Mexico temperatures for Clearwater Beach:
January
- Average High: 72° F
- Average Low: 50° F
- Average Precipitation: 3.17 inches
- Average Gulf Temperature: 68° F
February
- Average High Temperature: 73° F
- Average Low Temperature: 52° F
- Average Precipitation: 3.14 inches
- Average Gulf Temperature: 68° F
March
- Average High Temperature: 77° F
- Average Low Temperature: 56° F
- Average Precipitation: 3.85 inches
- Average Gulf Temperature: 68° F
April
- Average High Temperature: 81° F
- Average Low Temperature: 61° F
- Average Precipitation: 1.96 inches
- Average Gulf Temperature: 68° F
May
- Average High Temperature: 87° F
- Average Low Temperature: 67° F
- Average Precipitation: 3.02 inches
- Average Gulf Temperature: 77° F
June
- Average High Temperature: 90° F
- Average Low Temperature: 72° F
- Average Precipitation: 5.78 inches
- Average Gulf Temperature: 82° F
July
- Average High Temperature: 91° F
- Average Low Temperature: 74° F
- Average Precipitation: 7.07 inches
- Average Gulf Temperature: 84° F
August
- Average High Temperature: 92° F
- Average Low Temperature: 73° F
- Average Precipitation: 8.47 inches
- Average Gulf Temperature: 86° F
September
- Average High Temperature: 90° F
- Average Low Temperature: 72° F
- Average Precipitation: 7.25 inches
- Average Gulf Temperature: 84° F
October
- Average High Temperature: 85° F
- Average Low Temperature: 65° F
- Average Precipitation: 3.36 inches
- Average Gulf Temperature: 81° F
November
- Average High Temperature: 79° F
- Average Low Temperature: 58° F
- Average Precipitation: 2.37 inches
- Average Gulf Temperature: 75° F
December
- Average High Temperature: 74° F
- Average Low Temperature: 52° F
- Average Precipitation: 2.98 inches
- Average Gulf Temperature: 72° F
For up-to-date weather conditions, forecasts, and more, visit weather.com.


