Overview of Jacksonville Weather
- Annual Climate Summary
- Monthly Weather Breakdown
- Preparation for Hurricane Season
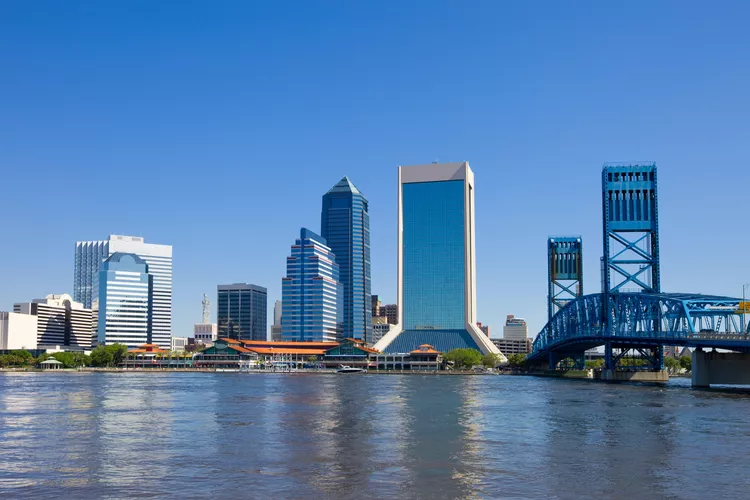
Jacksonville, located in Northeast Florida, is bordered by the St. Johns River and the Atlantic Ocean. This beautiful destination is about 25 miles (40.23 km) south of the Florida-Georgia state line, providing a unique climate that offers average high temperatures around 79 F and lows of 59 F throughout the year. However, the temperature can vary significantly, making it essential to plan accordingly.
Understanding Jacksonville’s Climate
When assessing temperatures in Jacksonville, July is generally recognized as the warmest month, while January tends to be the coolest. Additionally, September usually records the highest average rainfall. Therefore, it is crucial to be prepared for possible weather fluctuations during your visit.
What to Pack for Jacksonville
For a comfortable trip to Jacksonville, especially in summer, here are some packing tips:
- Shorts and sandals for hot days.
- A light sweater if you plan to spend the evening by the water.
- Layered clothing to accommodate varying temperatures throughout the day.
- Warm clothing for the winter months.
- Don’t forget your bathing suit for potential beach trips or heated pools.
Despite Jacksonville not facing hurricanes in recent years, visitors should remain informed about hurricane preparedness, particularly during hurricane season, which runs from June 1 to November 30. Therefore, confirming a hurricane guarantee with your accommodations is advisable.
Monthly Weather Breakdown
January
- Average High: 64 F
- Average Low: 45 F
- Average Precipitation: 3.39 inches
- Average Ocean Temperature: 57 F
February
- Average High: 67 F
- Average Low: 47 F
- Average Precipitation: 2.59 inches
- Average Ocean Temperature: 56 F
March
- Average High: 73 F
- Average Low: 53 F
- Average Precipitation: 3.97 inches
- Average Ocean Temperature: 61 F
April
- Average High: 79 F
- Average Low: 58 F
- Average Precipitation: 2.72 inches
- Average Ocean Temperature: 68-71 F
May
- Average High: 85 F
- Average Low: 66 F
- Average Precipitation: 3.22 inches
- Average Ocean Temperature: 74-77 F
June
- Average High: 89 F
- Average Low: 71 F
- Average Precipitation: 5.78 inches
- Average Ocean Temperature: 80-81 F
July
- Average High: 90 F
- Average Low: 74 F
- Average Precipitation: 5.99 inches
- Average Ocean Temperature: 83-84 F
August
- Average High: 89 F
- Average Low: 74 F
- Average Precipitation: 5.87 inches
- Average Ocean Temperature: 83 F
September
- Average High: 86 F
- Average Low: 71 F
- Average Precipitation: 7.28 inches
- Average Ocean Temperature: 83-82 F
October
- Average High: 79 F
- Average Low: 63 F
- Average Precipitation: 3.30 inches
- Average Ocean Temperature: 78-72 F
November
- Average High: 72 F
- Average Low: 55 F
- Average Precipitation: 2.35 inches
- Average Ocean Temperature: 67 F
December
- Average High: 65 F
- Average Low: 47 F
- Average Precipitation: 2.45 inches
- Average Ocean Temperature: 60 F
For accurate current weather conditions and forecasts, consider visiting weather.com.
If you’re considering a trip to the beautiful state of Florida, ensure that you understand the local weather patterns and events that may coincide with your travel dates to enhance your overall experience.


